Navigation
DISCLAIMER:
The nowcast/forecast system and other analyses/data are research
products under development. No warranty is made, expressed or implied,
regarding accuracy, or regarding the suitability for any particular application. All rights reserved University of South Florida, Ocean Circulation Lab.
Copyright University of South Florida 2010
General Background
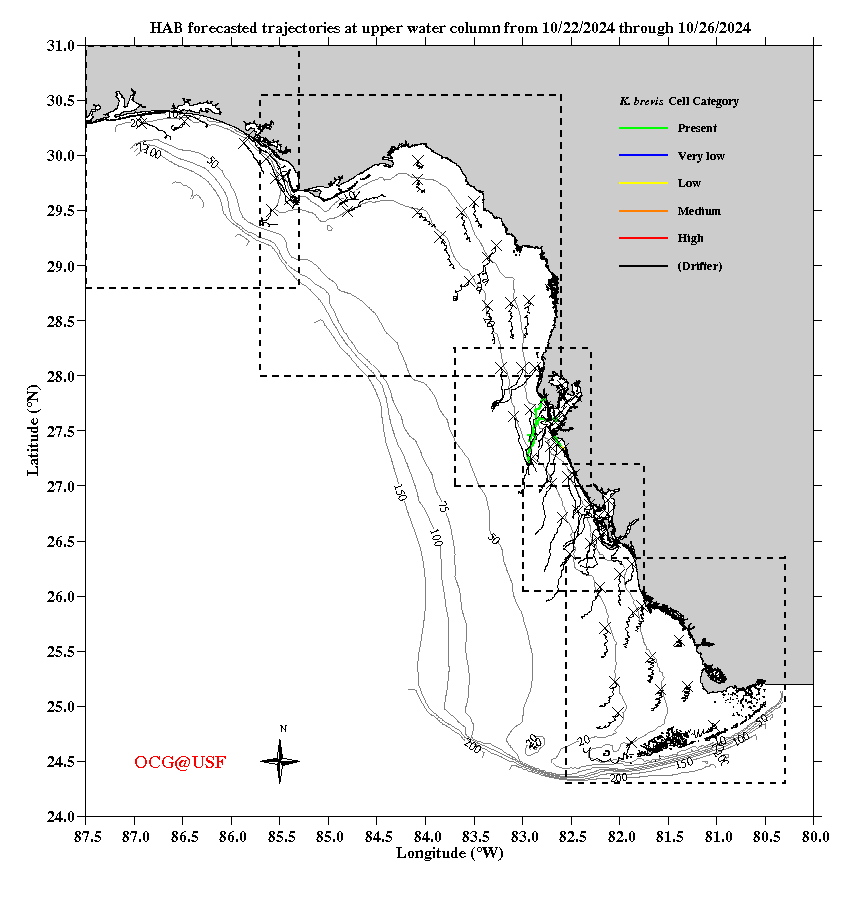
In partnership with the Florida Fish and Wildlife Conservation Commission (FWC), the Collaboration for Prediction of Red Tides (CPR) at the University of South Florida offers a new Harmful Algal Bloom (HAB) tracking tool to help federal, state, and local end users monitor and manage Karenia brevis, red tide blooms on the west coast of Florida. FWC data are uploaded daily into the West Florida Coastal Ocean Model (WFCOM). The model then generates 3.5 day forecasts of the bloom trajectories at a spatial resolution as fine as 150 m in the estuaries and inlets. The WFCOM is a 3-D, density dependent model that downscales from the deep ocean, across the continental shelf and into the estuaries (e.g., Zheng and Weisberg, 2012). The HAB tracking tool displays modeled bloom trajectories at the surface and the bottom subject to data availability. Bloom concentrations are color coded according to FWC's protocols.
ref: Zheng, L. and R.H. Weisberg (2012) Modeling the west Florida coastal ocean by downscaling from the deep ocean, across the continental shelf and into the estuaries, Ocean modeling, 48, 10-29.
Upper Water Column
The "X" represents the starting point where each sample was collected. The lines show the 3.5 day trajectory for each sample. The color represents the red tide concentration for each sample. Black lines represent simulated drifter trajectories.
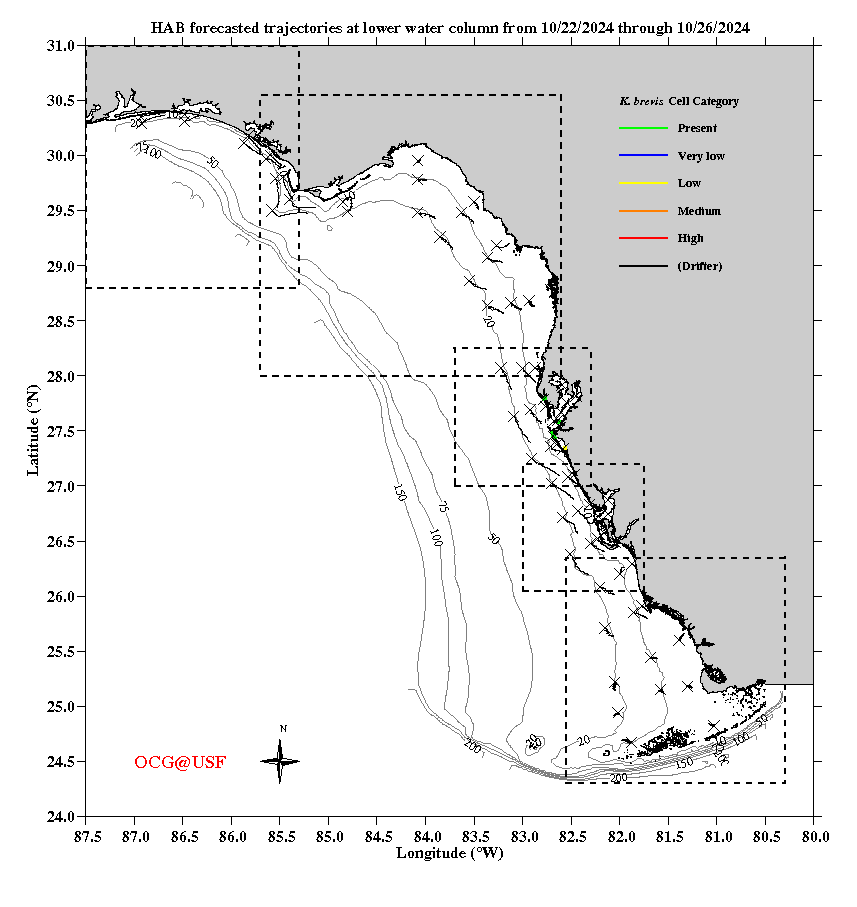
Lower Water Column
The "X" represents the starting point where each sample was collected. The lines show the 3.5 day trajectory for each sample. The color represents the red tide concentration for each sample. Black lines represent simulated drifter trajectories.
Acknowledgements
The FVCOM HAB tracking tool has benefited from several sources of funding beginning with the FWC and USF. Additional resources from ONR, NOAA and NASA have helped advance the modeling effort over the years.
HAB Tracking
- HAB Tracking for the West Florida Shelf Region
- HAB Tracking for the Tampa Bay Region
- Seasonal Prediction of Red Tide Bloom
- Base Map Archives
- Panhandle Archives
- Big Bend Archives
- Tampa Bay Archives
- Charlotte Harbor Archives
- Florida Bay and Keys Archives
- USF Center for Red Tide Tracking & Forecasting
- USF Near Real-Time Integrated Red tide Information System (IRIS)
- FWC Red Tide Page
- Red Tide Facebook Page
- Mote Beach Conditions Page